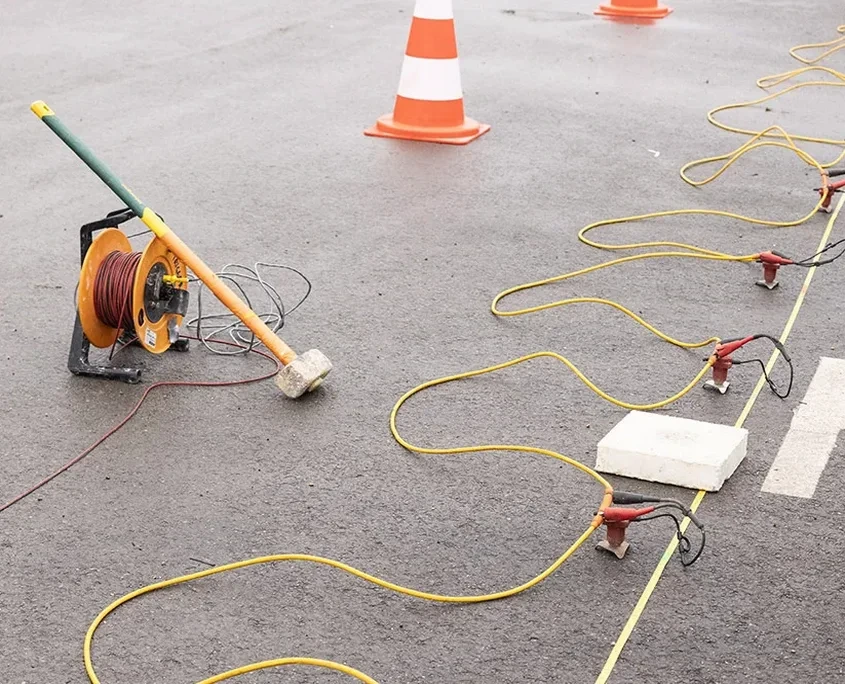
The geophone spread cable snakes across the asphalt of a former mill yard off Shrewsbury Street, its 24 channels waiting for the impact of the sledgehammer on the steel plate. That first compressional wave races through the glacial till that blankets much of Worcester—a city built on drumlins and ancient lake deposits—and refracts along the buried bedrock surface somewhere between 15 and 70 feet down. Our seismic tomography surveys turn the arrival time of each wave at each receiver into a velocity model that reads like a CT scan of the subsurface. For engineers dealing with the irregular, weathered schist and gneiss of the Nashoba Terrane, that image answers the question that test borings alone cannot: where exactly does competent rock begin, and where do low-velocity fracture zones cross the building pad? Because Worcester’s downtown sits at roughly 480 feet elevation on a topographic saddle between Lake Quinsigamond and the Blackstone River valley, depth to bedrock can shift dramatically within a single lot. We run the survey, process the first breaks with tomographic inversion software, and deliver a 2D or 3D profile that shows you the seismic velocity distribution directly beneath your proposed footings. When the project requires deeper structural information, a seismic refraction line combined with complementary MASW surface-wave data provides both the P-wave and S-wave velocity structure needed for Site Class determination under the IBC and ASCE 7.
A velocity tomogram is the closest thing you will get to an X-ray of the ground before you break earth—and in Worcester’s glacial terrain, it is the only way to map the bedrock surface continuously between borings.
Methodology and scope
With a population approaching 210,000 and a building stock that mixes 19th-century brick mill structures with new steel-frame lab and residential towers, Worcester presents a geophysical target environment that rewards careful parameter selection. Our tomographic surveys in the city typically deploy 24 or 48 geophone channels at 5- to 10-foot spacing, generating seismic energy with a combination of sledgehammer and accelerated weight drop sources that push useful signal through the urban noise floor—Route 9 traffic, commuter rail operations, and the constant hum of HVAC equipment on commercial roofs all contribute to a background vibration level that cheap single-geophone systems cannot overcome. We process the field records with iterative ray-tracing inversion algorithms rather than the older delay-time methods, because the velocity gradients in partially weathered Worcester schist demand a model that honors curved ray paths. The resulting velocity cross-sections, calibrated against at least one
test pit or borehole for lithologic control, let us map the rippability limit for excavation contractors and identify low-velocity zones that correlate with water-bearing fractures—critical information when designing dewatering systems or planning
deep excavations adjacent to existing foundations. For sites where the reflection method is more appropriate—such as mapping stratigraphic boundaries below 100 feet in the unconsolidated section—we combine the refraction spread with a higher-fold CMP acquisition geometry and apply post-stack depth migration to resolve layers that a standard refraction survey would miss.
Site-specific factors
The Massachusetts State Building Code (780 CMR), which incorporates ASCE 7 Chapter 16 with regional amendments, demands that seismic site classification not be based on interpolation from distant boring logs when the local geology is as chaotic as Worcester’s. The city straddles the boundary between the Avalon and Nashoba terranes, and the bedrock surface is frequently incised by buried pre-glacial valleys now filled with compressible organic silt and loose saturated sand—conditions that can amplify ground motion and go entirely undetected by a conventional drilling program on a 50-foot grid. We have seen sites near Indian Lake where bedrock drops 40 feet across less than 100 horizontal feet, creating a velocity contrast that concentrates shear strain in the overlying soil column during the moderate New England earthquakes that the USGS hazard maps project. Tomographic inversion of refraction data reveals those lateral velocity gradients directly, allowing the geotechnical engineer to decide whether a uniform Site Class D assignment is conservative enough or whether Site Class E differential settlement triggers must be addressed. Omitting this step risks designing a foundation system for a soil profile that does not exist across half the footprint—a discovery that during construction becomes exponentially more expensive than the cost of the survey.
Reference standards
ASCE 7-22 (Minimum Design Loads, seismic site classification via Vs30), IBC 2021 / 780 CMR (Massachusetts Building Code with seismic provisions), ASTM D5777-18 (Standard Guide for Seismic Refraction Method), ASTM D7400-19 (Standard Test Methods for Downhole Seismic Testing, crosshole reference), AASHTO R 22-20 (Geophysical subsurface site characterization, for transportation projects)
Quick answers
How much does a seismic tomography survey cost for a typical Worcester commercial lot?
For a standard refraction tomography line with 24 geophones and sledgehammer source, you are generally looking at US$2,670 to US$5,360 per line depending on spread length, number of shot points, and whether we are processing for velocity tomography or a simple delay-time interpretation. A full site-classification package combining refraction and MASW on the same spread runs toward the upper end of that range. Urban access constraints—traffic control on streets like Park Avenue or Highland Street—can add mobilization costs, so we always walk the site before quoting.
Can seismic tomography work in the tight spaces between downtown Worcester buildings?
It can, within limits. We have successfully run short 12-channel spreads in alleyways and parking lots where a full 240-foot line will not fit. The trade-off is reduced depth of investigation—roughly one-third to one-fifth of the spread length. In extremely confined sites, we sometimes supplement the surface line with downhole seismic measurements in a single borehole to extend the velocity model downward, and we pay close attention to side reflections from adjacent foundation walls that can contaminate the first-arrival picks.
What is the difference between seismic refraction tomography and a standard refraction survey?
A standard refraction survey interprets the subsurface as a stack of flat, constant-velocity layers using intercept-time or delay-time methods. That works reasonably well in simple geology. Tomography, by contrast, divides the subsurface into a grid of small cells and iteratively adjusts the velocity of each cell until the modeled travel times match the field data. The result is a continuous velocity image that captures lateral gradients, dipping interfaces, and localized low-velocity zones—exactly the kind of complexity we see in the fractured and variably weathered bedrock across Worcester.
Do you need a boring to calibrate the seismic velocity model?
A calibration boring or test pit is not strictly required to produce a velocity tomogram, but it transforms the interpretation from 'velocity anomaly' to 'weathered schist with 60% RQD.' We strongly recommend at least one point of lithologic ground truth, especially when the velocity model will be used to set foundation bearing elevations or to justify a Site Class upgrade. In Worcester’s glacial stratigraphy, a 10-foot-thick boulder layer can look seismically identical to shallow bedrock, and only a boring can tell them apart with certainty.